A tcpdump Tutorial with Examples

tcpdump is the world's premier network analysis tool—combining both power and simplicity into a single command-line interface. This guide will show you how to use it.
It allows you to capture and inspect network traffic in real-time. This tool is invaluable for network administrators, security professionals, and anyone who needs to understand network behavior.
In this tutorial, we'll explore 150 practical examples of using tcpdump. These examples will cover a wide range of use cases, from basic traffic capture to advanced filtering and analysis.
Basic Syntax
The basic syntax of tcpdump is:
tcpdump [options] [expression]options: Modify the behavior oftcpdump, such as specifying the interface to capture on or the output format.expression: Defines what kind of traffic to capture. This is where you specify hostnames, IP addresses, ports, protocols, and other criteria.
Three terms come up constantly, so here they are up front.
Capturing Traffic on an Interface
To capture all traffic on a specific interface, use the -i flag followed by the interface name. For example, to capture traffic on the eth0 interface:
tcpdump -i eth0To see a list of all available interfaces, use the command:
tcpdump -DCapturing Traffic to/from a Specific Host
To capture traffic to or from a specific host, use the host keyword followed by the hostname or IP address:
tcpdump host 192.168.1.100This will capture all traffic to and from the host with the IP address 192.168.1.100.
Capturing Traffic on a Specific Port
To capture traffic on a specific port, use the port keyword followed by the port number:
tcpdump port 80This will capture all traffic on port 80 (HTTP).
Combining Filters
You can combine filters using and, or, and not operators. For example, to capture all traffic to or from host 192.168.1.100 on port 80, use:
tcpdump host 192.168.1.100 and port 80To capture traffic from 192.168.1.100 on either port 80 or 443, use:
tcpdump src host 192.168.1.100 and \( port 80 or port 443 \)Advanced Filtering
Filtering by Protocol
To filter by protocol, use the ip, tcp, udp, or other protocol keywords. For example, to capture only TCP traffic:
tcpdump tcpTo capture only UDP traffic:
tcpdump udpFiltering by Source or Destination
To filter by source or destination host or port, use the src or dst keywords:
tcpdump src host 192.168.1.100This will capture all traffic from the host 192.168.1.100.
tcpdump dst port 443This will capture all traffic destined for port 443.
Filtering by Network
To capture traffic within a specific network, use the net keyword:
tcpdump net 192.168.1.0/24This will capture all traffic within the 192.168.1.0/24 network.
Saving Captured Traffic to a File
To save captured traffic to a file, use the -w flag followed by the filename:
tcpdump -w capture.pcap -i eth0This will save all captured traffic on the eth0 interface to the file capture.pcap.
You can later analyze this file using tcpdump or another packet analyzer like Wireshark.
Reading Captured Traffic from a File
To read captured traffic from a file, use the -r flag followed by the filename:
tcpdump -r capture.pcapThis will read and display the traffic from the file capture.pcap.
Verbosity
You can control the verbosity of tcpdump output using the -v, -vv, or -vvv flags.
-v: Verbose output.-vv: More verbose output.-vvv: Most verbose output.
For example:
tcpdump -vv -i eth0Reading the Output
Once packets are scrolling past, you need to be able to read them. Here's a single line from a capture:
14:22:31.482913 IP 192.168.1.50.51514 > 93.184.216.34.443: Flags [S], seq 2841047511, win 65535, options [mss 1460,nop,wscale 6,sackOK,TS val 1291 ecr 0], length 0Left to right:
14:22:31.482913is the timestamp. Add-ttttto get the date as well.IPis the network protocol. You'll also seeIP6andARPhere.192.168.1.50.51514 > 93.184.216.34.443is source to destination. The last number on each side is the port, so this is a client on port 51514 talking to a web server on 443.Flags [S]are the TCP flags, which tell you where in the conversation you are.seq,ack, andwinare the sequence number, the acknowledgment number, and the receive window. There's noackon this SYN, but it appears on every packet after it.optionsare the TCP options the sender is offering, like maximum segment size and window scaling.length 0is the payload size. This SYN carries no data, so it's zero.
Memorize the flag letters, because they show up in nearly every line of TCP output.
| Output | Flag | What it means |
|---|---|---|
[S] | SYN | Someone is opening a connection |
[S.] | SYN + ACK | The other side accepted |
[.] | ACK | The dot is the ACK flag, with no other flags set |
[P.] | PSH + ACK | Data being delivered |
[F.] | FIN + ACK | One side is closing politely |
[R] or [R.] | RST | Connection refused or torn down |
A healthy connection opens with [S], [S.], [.]. If you see [S] followed by [R.], the port is closed. If you see [S] repeated with no answer, something is dropping the traffic, and that's usually a firewall.
How Byte Offsets Work
A lot of the examples below have expressions like ip[8] and tcp[13] in them. The rule is that proto[offset:size] reads size bytes starting offset bytes into that protocol's header, counting from zero. Leave the size off and you get one byte.
Each row of the header diagram at the top of this page is four bytes. TTL is the first byte of the third row, which makes it the ninth byte, so it's ip[8]. The protocol field is next, so it's ip[9].
| Expression | Field |
|---|---|
ip[2:2] | Total packet length |
ip[6:2] | Fragment flags and offset |
ip[8] | TTL |
ip[9] | Protocol (6 is TCP, 17 is UDP, 1 is ICMP) |
ip[12:4] | Source address |
ip[16:4] | Destination address |
tcp[0:2] | Source port |
tcp[2:2] | Destination port |
tcp[12] | Header length, in the top four bits |
tcp[13] | The flags byte |
tcp[14:2] | Window size |
The flags byte is the one you'll use most. Each flag is one bit, and the hex values you see in the examples are just those bits added together.
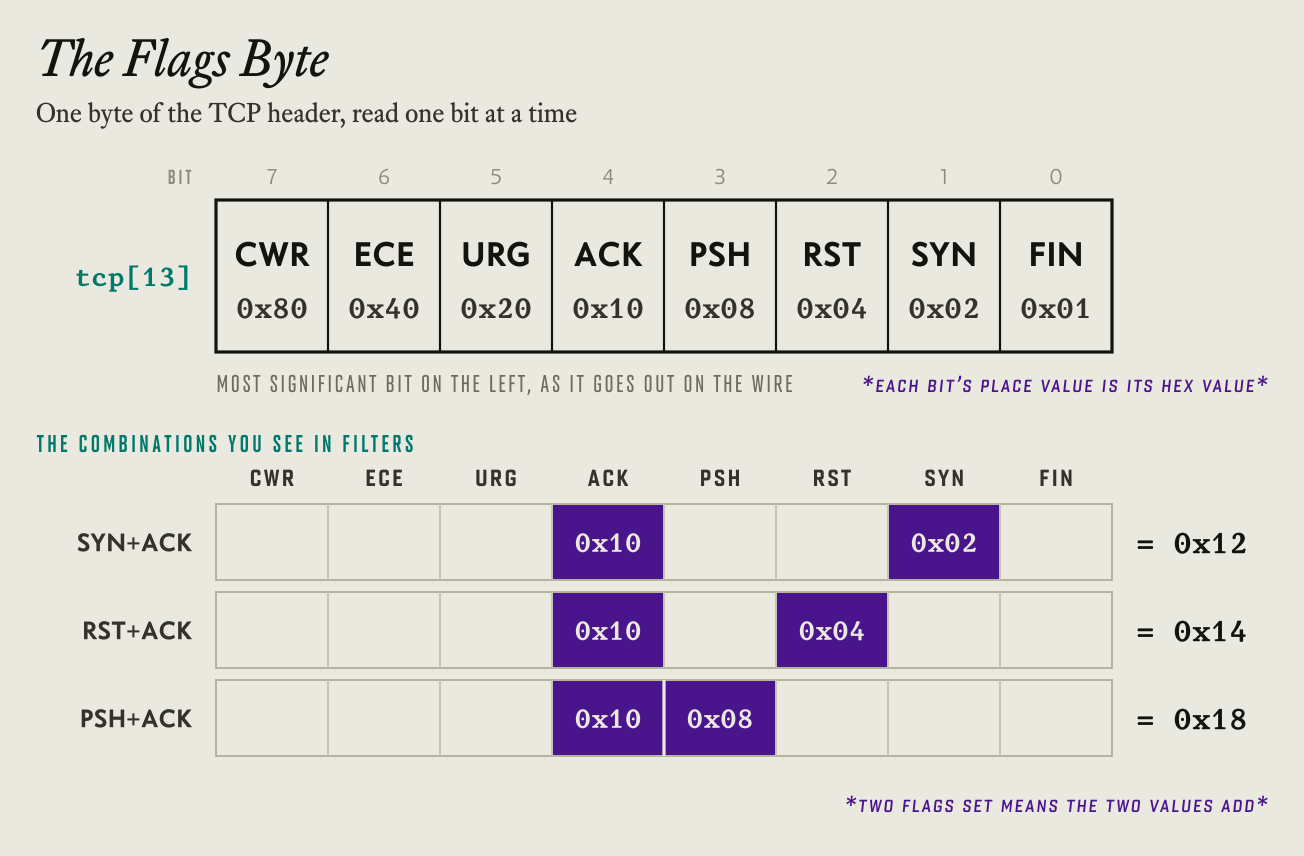
| Flag | Value | Keyword |
|---|---|---|
| FIN | 0x01 | tcp-fin |
| SYN | 0x02 | tcp-syn |
| RST | 0x04 | tcp-rst |
| PSH | 0x08 | tcp-push |
| ACK | 0x10 | tcp-ack |
| URG | 0x20 | tcp-urg |
| ECE | 0x40 | tcp-ece |
| CWR | 0x80 | tcp-cwr |
So 0x12 is SYN plus ACK, 0x14 is RST plus ACK, 0x18 is PSH plus ACK, and 0x11 is FIN plus ACK. tcpdump also lets you write tcp[tcpflags] instead of tcp[13], and tcp-syn instead of 0x02, which reads better.
There are two ways to test the byte, and they mean different things:
# SYN is set, and I don't care what else is
tcpdump 'tcp[tcpflags] & tcp-syn != 0'

# SYN is set and ACK is not, which is a new connection attempt
tcpdump 'tcp[tcpflags] & (tcp-syn|tcp-ack) = tcp-syn'The first one matches both the [S] and the [S.] of a handshake. The second matches only the opening [S], which is what you want when you're counting new connection attempts. You'll see tcp[tcpflags] = tcp-syn used for this in a lot of places, but it misses SYNs from hosts that negotiate ECN, because those set two extra flags.
The filter that finds HTTP GET requests shows how these pieces fit together:
tcpdump -A 'tcp dst port 80 and tcp[((tcp[12:1] & 0xf0) >> 2):4] = 0x47455420'The TCP header varies in length, so the payload starts at a different offset from packet to packet. tcp[12:1] & 0xf0 pulls out the header length, and >> 2 converts it to bytes, which gives you the offset of the first payload byte.
Then :4 reads four bytes from there and compares them to 0x47455420, which is the ASCII for GET with its trailing space. Swap in 0x504f5354 and you're matching POST.
Flags Worth Knowing
These are the flags to learn after the basics above.
| Flag | What it does |
|---|---|
-Q in / -Q out | Capture one direction only |
-e | Show MAC addresses, which you need for ARP and VLAN work |
-U | Write each packet to the file as it arrives instead of buffering |
-l | Same idea for printed output, so pipes to grep and tee stay live |
-K | Skip checksum verification, which stops false "bad checksum" noise from offloading NICs |
-B 4096 | Bigger kernel buffer (in KiB) when you're dropping packets |
-Z user | Drop root privileges to this user after opening the interface |
-z gzip | Compress each file after rotation, used with -C or -G |
-F file | Read the filter from a file, good for long expressions you reuse |
-d | Print the compiled filter and exit, which is how you check what a filter really does |
--print | Print packets to the screen while also writing them with -w |
--number | Print a packet number at the start of each line |
--time-stamp-precision=nano | Nanosecond timestamps, where the hardware supports it |
# Watch and save at the same time
tcpdump -nn -i eth0 -w capture.pcap --print 'port 53'

# Hourly capture files, compressed as they roll
tcpdump -nn -i eth0 -G 3600 -w 'cap-%Y%m%d-%H.pcap' -z gzip

# Only what this machine is sending
tcpdump -nn -i eth0 -Q outRemote Capture into Wireshark
You have a server with no GUI, and you want to look at its traffic in Wireshark on your laptop, live:
ssh root@server "tcpdump -U -s 0 -w - -i eth0 'not port 22'" | wireshark -k -i --w - writes the capture to standard output, -U flushes each packet immediately, and SSH carries the stream to Wireshark, which reads it from standard input with -i -. Keep the not port 22, because without it you capture your own SSH session, which generates more SSH traffic, which you also capture, in a loop.
If you just want the file:
ssh root@server "tcpdump -s 0 -c 5000 -w - -i eth0 'port 53'" > dns.pcapIf you need one capture to feed several tools at once, I wrote up how to do that in Capturing Traffic Once and Making That Traffic Available to Multiple Tools.
Containers and Cloud
Containers have their own network namespaces, so running tcpdump on the host often shows you a bridge interface and not much else. What works is running the host's tcpdump inside the container's network namespace, which leaves the container itself untouched.
# Docker, using the host's tcpdump inside the container's network namespace
nsenter -t $(docker inspect -f '{{.State.Pid}}' mycontainer) -n tcpdump -nn -i eth0

# Docker, attaching a throwaway toolbox container to the same network
docker run --rm -it --net container:mycontainer nicolaka/netshoot tcpdump -nn -i eth0

# Kubernetes, with an ephemeral debug container in the pod
kubectl debug -it mypod --image=nicolaka/netshoot --target=mycontainer --profile=netadmin -- tcpdump -nn -i eth0In a cloud VPC, promiscuous mode gets you nothing, because the provider's network only delivers traffic addressed to your instance. To see other machines' traffic you need the provider's mirroring feature, such as AWS VPC Traffic Mirroring, which wraps the mirrored packets in VXLAN and sends them to a collector you run:
# On the mirror target, mirrored traffic arrives as VXLAN
tcpdump -nn -i eth0 'udp port 4789'Working with Encrypted Traffic
Most traffic is TLS now. The payloads are encrypted, but the addresses, ports, timing, packet sizes, any DNS lookups that aren't going over DoH or DoT, and usually the server name the client asked for are all still visible.
That server name, the SNI, travels in cleartext in the Client Hello, including in TLS 1.3. The exception is a client using Encrypted Client Hello, which is still rare:
tcpdump -nn -A -s 0 -i eth0 'tcp port 443 and tcp[((tcp[12:1] & 0xf0) >> 2)] = 0x16 and tcp[((tcp[12:1] & 0xf0) >> 2)+5] = 0x01'Look for the hostname in the ASCII output.
HTTP/3 runs over QUIC, which is UDP, so a tcp port 443 filter misses it:
tcpdump -nn -i eth0 'udp port 443'When it's your own traffic and you need to read it, you can have the client log its session keys and let Wireshark decrypt the capture afterward. Browsers and curl both honor the SSLKEYLOGFILE variable:
export SSLKEYLOGFILE=~/tls-keys.log
tcpdump -nn -s 0 -w session.pcap -i eth0 'host example.com' &
curl https://example.com/
kill %1Then open session.pcap in Wireshark and point Preferences → Protocols → TLS → (Pre)-Master-Secret log filename at the key file.
IPv6
A lot of traffic is IPv6 now, and filters written with only IPv4 in mind will miss it.
# All IPv6
tcpdump -nn -i eth0 ip6

# A specific IPv6 host works the same way as IPv4
tcpdump -nn -i eth0 host 2001:db8::1

# ICMPv6, which IPv6 depends on far more than IPv4 depends on ICMP
tcpdump -nn -i eth0 icmp6

# Neighbor discovery, IPv6's replacement for ARP (types 135 and 136)
tcpdump -nn -i eth0 'icmp6 and (ip6[40] = 135 or ip6[40] = 136)'

# Router advertisements, where a rogue one can hijack a whole segment
tcpdump -nn -e -i eth0 'icmp6 and ip6[40] = 134'

# DHCPv6
tcpdump -nn -i eth0 'udp port 546 or udp port 547'Because tcp[...] doesn't work on IPv6, you count from the IPv6 header instead. It's a fixed 40 bytes, so the TCP flags byte sits at 40 + 13:
# SYN packets over IPv6
tcpdump -nn -i eth0 'ip6 and ip6[6] = 6 and ip6[53] & 0x02 != 0'This assumes no extension headers between the IPv6 header and what follows it, which is true for nearly all ordinary traffic. The same goes for the ip6[40] ICMPv6 filters above. A packet that carries extension headers will slip past them.
Troubleshooting
"You don't have permission to capture on that device." tcpdump needs root, or on Linux the right capabilities:
sudo setcap cap_net_raw,cap_net_admin=eip $(which tcpdump)"Packets dropped by kernel" is not zero. tcpdump couldn't keep up and you lost data. In order of how much they help: add -nn so it stops doing DNS lookups, write to a file with -w and skip printing, tighten the filter, and raise the buffer with -B 4096.
You see only your own traffic. That's a switch doing its job. You need a SPAN or mirror port, a network tap, or to capture on the machine in question.
"Bad checksum" on everything you send. Your network card computes the checksum after tcpdump has already seen the packet, so the packets are fine on the wire. Use -K to quiet it.
Filter errors that mention syntax. The shell is probably eating your parentheses or brackets. Put the whole expression in single quotes.
Your filter stops matching on a trunk port. Traffic with VLAN tags shifts every offset by four bytes. Put vlan and in front of the expression, as in tcpdump -nn -e -i eth0 'vlan and host 10.0.1.50'.
Output arrives in bursts when piped. Add -l for printed output or -U for files.
Companion Tools
tcpdump is for capturing and for quick looks. For deeper analysis, open the pcap in one of these.
- Wireshark and tshark when you need full protocol decoding. tshark is the command-line version, and it can pull specific fields out of a capture, like every DNS query name.
- termshark when you want the Wireshark interface inside a terminal on a remote box.
- ngrep when you want to grep packet payloads with a regex.
- Zeek when you have hours of capture and want connection logs, DNS logs, and file extraction instead of packets.
The pcap-filter man page is the full reference for the filter language. It documents the proto[offset:size] syntax and every keyword used here.
tcpdump and AI
I've written that AI is the end of tutorial webpages, and a model helps with tcpdump in two ways.
One is writing filters. Describe the traffic in plain English, ask for a BPF expression, and then check that it compiles with tcpdump -d 'your filter', then test it against a saved capture with tcpdump -r capture.pcap 'your filter' before trusting it. Models still get byte offsets wrong sometimes, so run the check every time.
The other is triage. tcpdump's text output is compact enough to hand to a model and ask what stands out:
tcpdump -nn -tttt -r capture.pcap | head -2000 | fabric -p analyze_logs150 tcpdump Examples
Here are 150 tcpdump examples to help you isolate traffic in various situations:
Basic Capture
- Capture all traffic on interface
eth0:bashtcpdump -i eth0 - Capture all traffic on interface
wlan0:bashtcpdump -i wlan0 - Capture all traffic on all interfaces:bash
tcpdump -i any - Capture only the first 100 packets:bash
tcpdump -c 100 - List all available capture interfaces:bash
tcpdump -D
Output Formatting
- Don't resolve hostnames:bash
tcpdump -n -i eth0 - Don't resolve hostnames or port names:bash
tcpdump -nn -i eth0 - Show packet contents in ASCII:bash
tcpdump -A -i eth0 - Show packet contents in hex and ASCII:bash
tcpdump -X -i eth0 - Show human-readable timestamps:bash
tcpdump -tttt -i eth0 - Increase verbosity:bash
tcpdump -v -i eth0 - Maximum verbosity:bash
tcpdump -vvv -i eth0 - Capture full packets (already the default on modern versions, needed on old ones):bash
tcpdump -s 0 -i eth0 - Line-buffered output (useful for piping):bash
tcpdump -l -i eth0 | tee capture.txt
Host Filters
- Capture traffic to or from a specific IP:bash
tcpdump host 192.168.1.100 - Capture traffic to or from a hostname:bash
tcpdump host example.com - Capture traffic from a specific source host:bash
tcpdump src host 192.168.1.100 - Capture traffic to a specific destination host:bash
tcpdump dst host 192.168.1.100 - Capture traffic between two specific hosts:bash
tcpdump host 192.168.1.100 and host 192.168.1.200
Port Filters
- Capture traffic on port 80 (HTTP):bash
tcpdump port 80 - Capture traffic on port 443 (HTTPS):bash
tcpdump port 443 - Capture traffic on port 22 (SSH):bash
tcpdump port 22 - Capture traffic on port 53 (DNS):bash
tcpdump port 53 - Capture traffic on port 25 (SMTP):bash
tcpdump port 25 - Capture traffic on port 21 (FTP):bash
tcpdump port 21 - Capture traffic from a specific source port:bash
tcpdump src port 80 - Capture traffic to a specific destination port:bash
tcpdump dst port 443 - Capture traffic on a range of ports:bash
tcpdump portrange 8000-9000
Protocol Filters
- Capture all TCP traffic:bash
tcpdump tcp - Capture all UDP traffic:bash
tcpdump udp - Capture all ICMP traffic:bash
tcpdump icmp - Capture all ARP traffic:bash
tcpdump arp - Capture all IPv6 traffic:bash
tcpdump ip6
Network Filters
- Capture traffic to or from a network:bash
tcpdump net 192.168.1.0/24 - Capture traffic from a specific network:bash
tcpdump src net 192.168.1.0/24 - Capture traffic to a specific network:bash
tcpdump dst net 192.168.1.0/24
Combination Filters
- Capture traffic to a host on a specific port:bash
tcpdump dst host 192.168.1.100 and dst port 80 - Capture traffic from a host on a specific port:bash
tcpdump src host 192.168.1.100 and src port 443 - Capture traffic to or from a host on port 80 or 443:bash
tcpdump host 192.168.1.100 and \( port 80 or port 443 \) - Capture all traffic except ICMP:bash
tcpdump not icmp - Capture all traffic except SSH (port 22):bash
tcpdump not port 22 - Exclude your own SSH session while capturing:bash
tcpdump -i eth0 'not (host 192.168.1.50 and port 22)' - Capture HTTP or HTTPS traffic:bash
tcpdump port 80 or port 443 - Capture non-HTTP and non-HTTPS traffic:bash
tcpdump not port 80 and not port 443
TCP Flag Filters
- Capture TCP SYN packets:bash
tcpdump 'tcp[tcpflags] & tcp-syn != 0' - Capture TCP ACK packets:bash
tcpdump 'tcp[tcpflags] & tcp-ack != 0' - Capture TCP RST packets:bash
tcpdump 'tcp[tcpflags] & tcp-rst != 0' - Capture TCP FIN packets:bash
tcpdump 'tcp[tcpflags] & tcp-fin != 0' - Capture TCP URG packets:bash
tcpdump 'tcp[tcpflags] & tcp-urg != 0' - Capture TCP PSH packets:bash
tcpdump 'tcp[tcpflags] & tcp-push != 0' - Capture SYN-only packets (new connection attempts):bash
tcpdump 'tcp[tcpflags] & (tcp-syn|tcp-ack) = tcp-syn' - Capture SYN/ACK packets (connection accepted):bash
tcpdump 'tcp[tcpflags] = 0x12' - Capture RST/ACK packets (connection refused or reset):bash
tcpdump 'tcp[tcpflags] = 0x14' - Capture FIN/ACK packets (connection closing):bash
tcpdump 'tcp[tcpflags] = 0x11' - Capture PSH/ACK packets (data transfer):bash
tcpdump 'tcp[tcpflags] = 0x18' - Capture null scan packets (no flags set):bash
tcpdump 'tcp[tcpflags] = 0x00' - Capture Xmas tree scan packets (FIN+PSH+URG):bash
tcpdump 'tcp[tcpflags] & 0x29 = 0x29'
Saving and Reading Captures
- Write captured traffic to a file:bash
tcpdump -w capture.pcap -i eth0 - Read captured traffic from a file:bash
tcpdump -r capture.pcap - Read from a file with a filter applied:bash
tcpdump -r capture.pcap tcp port 80 - Rotate capture files every 100MB:bash
tcpdump -w capture.pcap -C 100 -i eth0 - Rotate capture files every hour:bash
tcpdump -w capture-%Y%m%d%H%M%S.pcap -G 3600 -i eth0 - Keep only the last 10 rotated capture files:bash
tcpdump -w capture.pcap -C 100 -W 10 -i eth0
IP Header Filters
- Capture IP fragments:bash
tcpdump 'ip[6:2] & 0x3fff != 0' - Capture packets arriving with a TTL of exactly 128 (a Windows host on your own segment, since every router hop subtracts one):bash
tcpdump 'ip[8] = 128' - Capture packets arriving with a TTL of exactly 64 (a Linux or Mac host on your own segment):bash
tcpdump 'ip[8] = 64' - Capture packets with DSCP value EF (46):bash
tcpdump 'ip[1] & 0xfc = 0xb8' - Capture packets with ECN Congestion Experienced:bash
tcpdump 'ip[1] & 0x03 = 3' - Capture packets of 500 bytes or more:bash
tcpdump greater 500 - Capture packets of 100 bytes or less:bash
tcpdump less 100
Payload and Content Inspection
- Capture HTTP GET requests:bash
tcpdump -s 0 -A 'tcp dst port 80 and tcp[((tcp[12:1] & 0xf0) >> 2):4] = 0x47455420' - Capture HTTP POST requests:bash
tcpdump -s 0 -A 'tcp dst port 80 and tcp[((tcp[12:1] & 0xf0) >> 2):4] = 0x504f5354' - Capture DNS query traffic:bash
tcpdump -n 'udp dst port 53' - Capture DHCP traffic (discover, offer, request, and ack):bash
tcpdump -n 'udp port 67 or udp port 68' - Capture TLS Client Hello packets (new HTTPS connections):bash
tcpdump 'tcp port 443 and tcp[((tcp[12:1] & 0xf0) >> 2)] = 0x16 and tcp[((tcp[12:1] & 0xf0) >> 2)+5] = 0x01'
Security Engineer Use Cases
- Capture cleartext FTP credentials:bash
tcpdump -nn -A -i eth0 'port 21' - Capture HTTP Basic Authentication headers:bash
tcpdump -nn -A -s 0 -i eth0 'tcp dst port 80' - Capture cleartext SMTP authentication:bash
tcpdump -nn -A -i eth0 'tcp port 25 or tcp port 587' - Capture cleartext POP3/IMAP credentials:bash
tcpdump -nn -A -i eth0 'tcp port 110 or tcp port 143' - Detect ARP spoofing (excessive ARP replies):bash
tcpdump -nn -e -i eth0 'arp[6:2] = 2' - Identify DNS exfiltration (unusually large DNS packets):bash
tcpdump -nn -i eth0 'udp port 53 and greater 512' - Detect DNS tunnel responses (oversized replies):bash
tcpdump -nn -i eth0 'udp src port 53 and greater 300' - Detect rogue DHCP servers:bash
tcpdump -nn -e -i eth0 'udp src port 67' - Detect brute force attacks on authentication services:bash
tcpdump -nn -i eth0 'tcp[tcpflags] & (tcp-syn|tcp-ack) = tcp-syn and (dst port 22 or dst port 3389 or dst port 445)' - Capture SSH connection attempts with timestamps:bash
tcpdump -nn -tttt -i eth0 'tcp dst port 22 and tcp[tcpflags] & (tcp-syn|tcp-ack) = tcp-syn' -c 200 - Capture LDAP authentication traffic:bash
tcpdump -nn -A -i eth0 'tcp port 389 or tcp port 636' - Capture Kerberos authentication traffic:bash
tcpdump -nn -i eth0 'tcp port 88 or udp port 88' - Detect cleartext Telnet sessions:bash
tcpdump -nn -A -i eth0 'tcp port 23' - Capture full TLS sessions for certificate analysis (certificates are only readable in TLS 1.2 and earlier):bash
tcpdump -nn -s 0 -w tls-sessions.pcap -i eth0 'tcp port 443' - Spot VLAN tagging anomalies:bash
tcpdump -nn -e -i eth0 'vlan' - Monitor new connections to low ports other than the common services:bash
tcpdump -nn -i eth0 'tcp[tcpflags] & (tcp-syn|tcp-ack) = tcp-syn and dst portrange 1-1023 and not (dst port 80 or dst port 443 or dst port 22 or dst port 53 or dst port 25)' - Detect unauthorized external DNS usage:bash
tcpdump -nn -i eth0 'udp dst port 53 and not dst host 10.0.0.1' - Detect lateral movement via SMB:bash
tcpdump -nn -i eth0 'tcp dst port 445 and src net 10.0.0.0/8 and dst net 10.0.0.0/8' - Detect lateral movement via WinRM:bash
tcpdump -nn -i eth0 'tcp dst port 5985 or tcp dst port 5986' - Detect lateral movement via RDP between internal hosts:bash
tcpdump -nn -i eth0 'tcp dst port 3389 and src net 192.168.0.0/16 and dst net 192.168.0.0/16'
Security Red Team / Blue Team Operations
- Detect outbound reverse shell connections:bash
tcpdump -nn -i eth0 'tcp[tcpflags] & (tcp-syn|tcp-ack) = tcp-syn and (dst port 4444 or dst port 1234 or dst port 5555 or dst port 9001)' - Find C2 beaconing patterns (periodic HTTPS connections):bash
tcpdump -nn -tttt -i eth0 'tcp dst port 443 and tcp[tcpflags] & (tcp-syn|tcp-ack) = tcp-syn' -c 500 - Detect ICMP tunneling (oversized ping packets):bash
tcpdump -nn -i eth0 'icmp and greater 100' - Detect DNS over HTTPS (DoH) bypassing corporate DNS:bash
tcpdump -nn -i eth0 'tcp dst port 443 and (dst host 1.1.1.1 or dst host 8.8.8.8 or dst host 8.8.4.4 or dst host 9.9.9.9)' - Find unauthorized OpenVPN tunnels:bash
tcpdump -nn -i eth0 'udp port 1194 or tcp port 1194' - Find unauthorized WireGuard tunnels:bash
tcpdump -nn -i eth0 'udp port 51820' - Detect cryptocurrency mining traffic (common Stratum pool ports):bash
tcpdump -nn -i eth0 'tcp dst port 3333 or tcp dst port 5555 or tcp dst port 14444' - Monitor for NTLM credential theft over SMB:bash
tcpdump -nn -s 0 -w ntlm-traffic.pcap -i eth0 'tcp port 445 or tcp port 139' - Detect data exfiltration (large outbound packets):bash
tcpdump -nn -i eth0 'src net 10.0.0.0/8 and not dst net 10.0.0.0/8 and greater 1000' - Monitor for unauthorized SOCKS proxy usage:bash
tcpdump -nn -i eth0 'tcp dst port 1080' - Detect ICMP ping sweep (host enumeration):bash
tcpdump -nn -i eth0 'icmp[0] = 8' -c 500 - Detect C2 traffic to a specific suspected host:bash
tcpdump -nn -tttt -i eth0 'tcp dst port 443 and tcp[tcpflags] & (tcp-syn|tcp-ack) = tcp-syn and dst host 192.0.2.100' - Monitor for LDAP enumeration (Active Directory recon):bash
tcpdump -nn -i eth0 'tcp dst port 389' -c 1000 - Detect PowerShell remoting via WinRM:bash
tcpdump -nn -A -s 0 -i eth0 'tcp dst port 5985' - Capture DNS traffic for C2 frequency analysis:bash
tcpdump -nn -i eth0 'udp port 53' -c 5000 -w dns-baseline.pcap - Detect HTTP tunneling (non-browser traffic):bash
tcpdump -nn -A -s 0 -i eth0 'tcp dst port 80 and src host 10.0.1.50' - Hunt for exfiltration via ICMP payload data:bash
tcpdump -nn -X -i eth0 'icmp[0] = 8 and greater 64' - Detect port knocking sequences:bash
tcpdump -nn -tttt -i eth0 'tcp[tcpflags] & (tcp-syn|tcp-ack) = tcp-syn and dst host 10.0.1.100' - Monitor for DNS rebinding attack responses:bash
tcpdump -nn -v -i eth0 'udp src port 53' -c 200 - Capture covert channel traffic over permitted DNS:bash
tcpdump -nn -i eth0 'udp dst port 53 and src host 10.0.1.50' -c 1000
Security Incident Response Team Operations
- Full packet capture from a compromised host:bash
tcpdump -nn -s 0 -w evidence-$(date +%Y%m%d-%H%M%S).pcap -i eth0 'host 10.0.1.50' - Time-windowed capture for incident timeline:bash
tcpdump -nn -s 0 -G 300 -w incident-%Y%m%d-%H%M%S.pcap -i eth0 'host 10.0.1.50' - Quick-triage packet capture with count limit:bash
tcpdump -nn -s 0 -c 10000 -w triage.pcap -i eth0 'host 10.0.1.50' - Capture HTTP response payloads for malware analysis:bash
tcpdump -nn -s 0 -A -i eth0 'tcp src port 80 and (((ip[2:2] - ((ip[0]&0xf)<<2)) - ((tcp[12]&0xf0)>>2)) != 0)' - Log DNS queries for IOC matching (UDP and TCP):bash
tcpdump -nn -i eth0 'dst port 53' -l | tee dns-queries.log - Capture traffic to known malicious IPs:bash
tcpdump -nn -s 0 -w malicious.pcap -i eth0 'host 203.0.113.10 or host 198.51.100.20 or host 192.0.2.30' - Capture only new TCP connections during an incident:bash
tcpdump -nn -tttt -i eth0 'tcp[tcpflags] & (tcp-syn|tcp-ack) = tcp-syn' - Long-running evidence capture with size rotation:bash
tcpdump -nn -s 0 -C 100 -W 50 -w evidence.pcap -i eth0 'host 10.0.1.50' - Capture ICMP error messages during an incident:bash
tcpdump -nn -v -i eth0 'icmp[0] = 3 or icmp[0] = 11' - Monitor for data exfiltration over email:bash
tcpdump -nn -A -s 0 -i eth0 'tcp dst port 25 or tcp dst port 587 or tcp dst port 465' - Capture all traffic to and from a compromised subnet:bash
tcpdump -nn -s 0 -w subnet-capture.pcap -i eth0 'net 10.0.1.0/24' - Detect internal scanning from a compromised host:bash
tcpdump -nn -i eth0 'tcp[tcpflags] & (tcp-syn|tcp-ack) = tcp-syn and src host 10.0.1.50 and dst net 10.0.0.0/8' - Capture evidence of internal data staging:bash
tcpdump -nn -i eth0 'src host 10.0.1.50 and dst net 10.0.0.0/8 and greater 1000' - Time-limited capture for legal evidence hold:bash
timeout 3600 tcpdump -nn -s 0 -w legal-hold-$(date +%Y%m%d).pcap -i eth0 'host 10.0.1.50' - Capture outbound traffic on ports other than web and DNS:bash
tcpdump -nn -i eth0 'src net 10.0.0.0/8 and not dst net 10.0.0.0/8 and not (dst port 80 or dst port 443 or dst port 53)'
Network Engineer / SysAdmin Use Cases
- Monitor TCP zero window events (flow control problems):bash
tcpdump -nn -i eth0 'tcp[14:2] = 0 and tcp[tcpflags] & tcp-ack != 0' - Detect ICMP "need to fragment" messages (MTU issues):bash
tcpdump -nn -v -i eth0 'icmp[0] = 3 and icmp[1] = 4' - Capture packets with Don't Fragment bit set:bash
tcpdump -nn -i eth0 'ip[6] & 0x40 != 0' - Monitor BGP sessions:bash
tcpdump -nn -i eth0 'tcp port 179' - Check NTP synchronization traffic:bash
tcpdump -nn -i eth0 'udp port 123' - Debug DHCP lease problems (full handshake):bash
tcpdump -nn -e -vv -i eth0 'udp port 67 or udp port 68' - Monitor VRRP failover traffic:bash
tcpdump -nn -i eth0 'ip proto 112' - Monitor HSRP failover traffic:bash
tcpdump -nn -i eth0 'udp dst port 1985' - Capture SNMP trap notifications:bash
tcpdump -nn -i eth0 'udp port 162' - Watch ARP with MAC addresses (two MACs answering for one IP usually means a duplicate, unless it's proxy ARP):bash
tcpdump -nn -e -i eth0 'arp' - Troubleshoot DNS resolution failures:bash
tcpdump -nn -v -i eth0 'udp port 53' - Capture SIP/VoIP signaling traffic:bash
tcpdump -nn -A -s 0 -i eth0 'tcp port 5060 or udp port 5060' - Capture the UDP range commonly used for RTP voice/video (the range varies by vendor):bash
tcpdump -nn -i eth0 'udp portrange 16384-32767' - Monitor RADIUS authentication:bash
tcpdump -nn -i eth0 'udp port 1812 or udp port 1813' - Monitor TACACS+ authentication:bash
tcpdump -nn -i eth0 'tcp port 49' - Check GRE tunnel traffic:bash
tcpdump -nn -i eth0 'ip proto 47' - Debug OSPF neighbor issues:bash
tcpdump -nn -i eth0 'ip proto 89' - Monitor EIGRP routing updates:bash
tcpdump -nn -i eth0 'ip proto 88' - Capture multicast traffic:bash
tcpdump -nn -i eth0 'dst net 224.0.0.0/4' - Verify QoS/DSCP markings on traffic:bash
tcpdump -nn -v -i eth0 'ip[1] & 0xfc != 0'
These examples should provide a solid foundation for using tcpdump to analyze network traffic.
Happy hunting!
-Daniel
Notes
- The official references are the tcpdump man page and the pcap-filter man page, which documents the IPv4-only behavior of the
tcp[...]offset expressions. - Wireshark's wiki explains decrypting TLS with a key log file.
- AWS documents VPC Traffic Mirroring, and Kubernetes documents ephemeral debug containers.
- 🤖 AIL 2: Daniel wrote the original tutorial. I (Kai, his AI assistant) corrected and relabeled some of the examples, and wrote the quick-start box, the three definitions, and every section from Reading the Output through tcpdump and AI. Learn more about AIL.