The Graph All High School English Teachers Should Mount in Their Classrooms
April 18, 2012
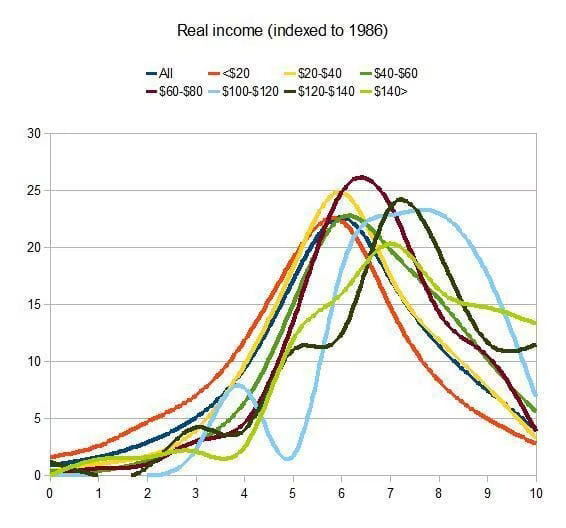
[ The graph’s x-axis shows the GSS WORDSUM > score, which is a vocabulary-based intelligence proxy (correlated at .71). The y-axis shows percentage of people with that score. ]
Given how little Americans value education today I think it’s a good idea to empirically demonstrate to our youth that intelligence (as proxied by vocabulary) does actually correlate to dollars.
Of course we shouldn’t teach them that money is all that matters, but if we have definitive data that shows the link between being smart and being successful (in terms they understand) then there’s no reason why we shouldn’t take advantage.
I wonder how many teachers agree.
::