Use Splunk as Your Remote Syslog Server
So I’ve been messing with Splunk >> a bit recently, and as part of that I’ve been sending logs from iptables, snort, and apache–not to mention the other stuff that naturally lands within /var/log/messages.
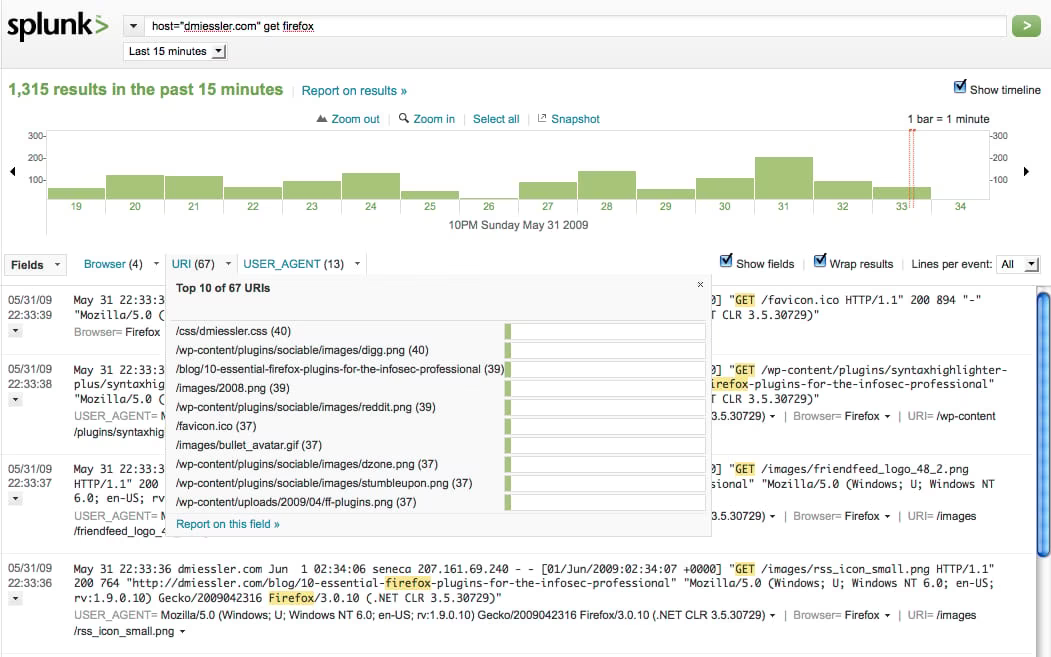
As you can see, the reason I’m doing this is to get a brutally powerful data view in one interface. Here I’m showing some GET requests within my Apache logs, but I currently have saved searches for all these various types of information:
drops on my firewall
accepts on my firewall
successful SSH logins (password or key)
failed SSH logins (password or key)
associations to my wireless
incoming GET requests to Apache
user agents
The key with Splunk> is the quickness in which you can search raw data, and create powerful visualizations of the results.
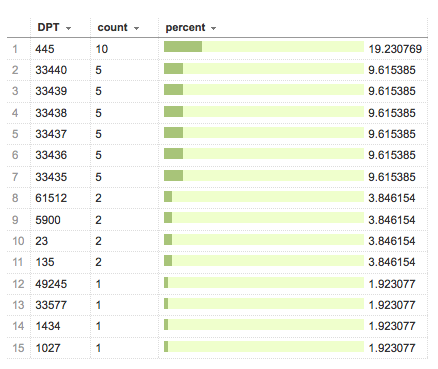
firewall drops by port within 3 hours
Syslog Setup
So this all requires that Splunk> see your log data; here’s how to set up syslog-ng to forward your various log types to an arbitrary destination.
netfilter/iptables
Log your desired traffic (this is my default-deny at the bottom of my ruleset)
[bash]/sbin/iptables -A INPUT -i eth0 -d $SENECA -j LOG –log-level 7 –log-prefix "Firewall: Default Deny: "[/bash]
This will automatically go to syslog on most systems.
Apache
You don’t do anything specific in Apache, other than make sure you’re logging the stuff you want. I prefer to get user-agent and such in my logs:
[bash]LogFormat "%h %l %u %t "%r" %>s %b "%{Referer}i" "%{User-Agent}i"" combinedLogFormat "%h %l %u %t "%r" %>s %b" commonLogFormat "%{Referer}i -> %U" refererLogFormat "%{User-Agent}i" agentLogFormat "%v %h %l %u %t "%r" %>s %b %T" scriptLogFormat "%v %h %l %u %t "%r" %>s %b "%{Referer}i" "%{User-Agent}i" VLOG=%{VLOG}e" vhost[/bash]
syslog
Then for the most important piece you have to:
Tell syslog-ng to parse your Apache logs
Tell syslog-ng to send logs to your remote system (Splunk, in this case)
First, here’s how you get arbitrary, quickly expanding logs into syslog-ng:
[bash]source access { file("/var/log/apache2/access_log" <em>follow_freq</em>(1) flags(no-parse));};[/bash]
This names a source access (for access_log) that will be harvested from a file. The file is my main Apache log. The important bit is the follow_freq(1), as it keeps you from having to do crazy tail / pipe tricks to get access_log’s input into syslog-ng. The 1 says to parse the file for new content every second.
Then you need to define a destination for your logs:
[bash]destination logserver { udp("your.remote.logserver.dns" port(514)); };[/bash]
And then give the log command, which calls your custom source and your custom destination:
[bash]log { source(access); destination(logserver); };[/bash]
[ ** Don’t forget to also add log lines for your default syslog source as well. ]
And that’s pretty much it. Configure Splunk to listen on UDP/514 and you will have some decent data to start playing with. ::