Displaying Data with Dashing

I’ve been writing for a long time about the essential future skill of being able to collect and display data.
I break it into three steps:
Harvesting data
Manipulate data
Display data

I’ve just started using Dashing to do the last part. The screenshot at the top shows one of the displays I made in a couple of minutes using this code for pulling air quality.
The most brilliant part of the project, however, is its ability to consume and display data in real time via POST.
curl -d '{ "auth_token": "YOUR_AUTH_TOKEN",
"text": "Hey, Look what I can do!" }'
http://localhost:3030/widgets/welcome
This command will instantly update the widget on the screen, which means you can do all sorts of web services calls, pull the JSON, and have the results get updated for you live
Here’s an example of a dashboard that uses it:
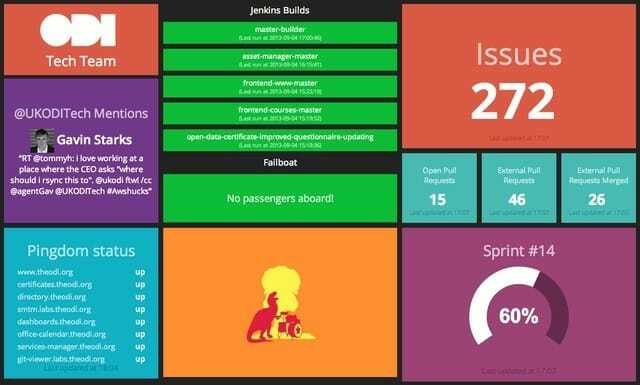
If you’re into data at all, this is one tool to get familiar with.
Notes
You’ll also want to take a look at D3, which is a JavaScript-based graphing system.