Creating a Realtime Traffic Dashboard with Google Analytics
Most know that Google Analytics is the standard for overall web stats, i.e. for granularity, going back in time, etc., but think that to get a good realtime view you need to go elsewhere.
So if you run a website of any significant size you’re probably using something like Chartbeat or Woopra to monitory incoming traffic in realtime (because Google wasn’t good at it).
Not true anymore.
Google Analytics now has some remarkably powerful realtime capabilities—many of which are even more powerful than the pure play options. Here’s how to set them up.
Sign in to your Google Analytics
Navigate to my shared Live Dashboard
Import it into your desired site and view
Enjoy
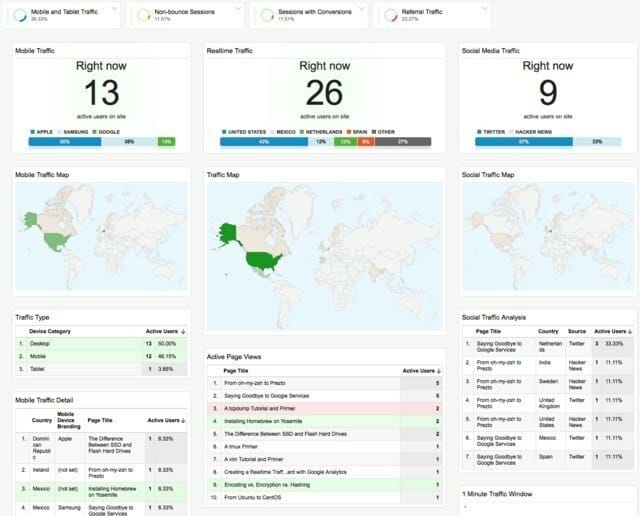
Here’s a breakdown of its main features:
A counter of all realtime traffic, broken down by country
A live traffic map for that traffic
A list of all active page views
A live counter of just mobile traffic, broken down by device brand
A live traffic map for just mobile traffic
A breakdown of mobile visits by page title, device, and country
A counter for all social media traffic, broken down by source
A traffic map for just social visits
A breakdown of social visits by page title, social source, and country
Live traffic counters for the last 1 minute and 30 minutes
Using this dashboard you can see a realtime breakdown of visitor traffic by country, mobile device type, and social media source—all visualized nicely on their own map displays.
TL;DR: Google has realtime capabilities. Import this dashboard to get started.
Notes
One thing that Google Analytics does differently than Chartbeat is it only shows a hit when it comes in. It doesn’t continue to track after the page is open to show you if they still have the tab open somewhere. So it will show an equally accurate view of reality, but it’ll show lower numbers.
I’ve found that Google Analytics is far more accurate and granular than Chartbeat at many things, especially breaking down mobile traffic in various ways. GA will often show a granular separation of 40% of my traffic being tablets and phones of various kinds, while Chartbeat under-reports it as only 20% with no visibility.
It must be said that it’d be really nice to have the Chartbeat feature of seeing who is still interacting with your content in some way beyond just marking the initial hit. I very much like that feature and wish that Google Analytics had it.
One of my main reasons for going back to Google Analytics from Chartbeat is performance and general performance snobbery. I don’t like loading multiple analytics engines and paying the transactions costs for each. I also don’t like that Chartbeat, in order to give those continuous stats, must constantly ping out. It basically means your page keeps loading forever on visitors’ computers. So I simplified with using just GA.